Site Reliability Engineering (SRE) & Observability
Site Reliability Engineering (SRE) is Google's battle-tested discipline of applying software engineering practices to infrastructure operations. Learn to architect production distributed tracing with OpenTelemetry (OTel), establish Service Level Objectives (SLOs) and Error Budgets in Grafana/Datadog, run automated chaos engineering experiments with Chaos Mesh, and automate zero-downtime canary rollouts.

🇮🇳 Indian Market Benchmark
Why This Skill Pays Off in 2026
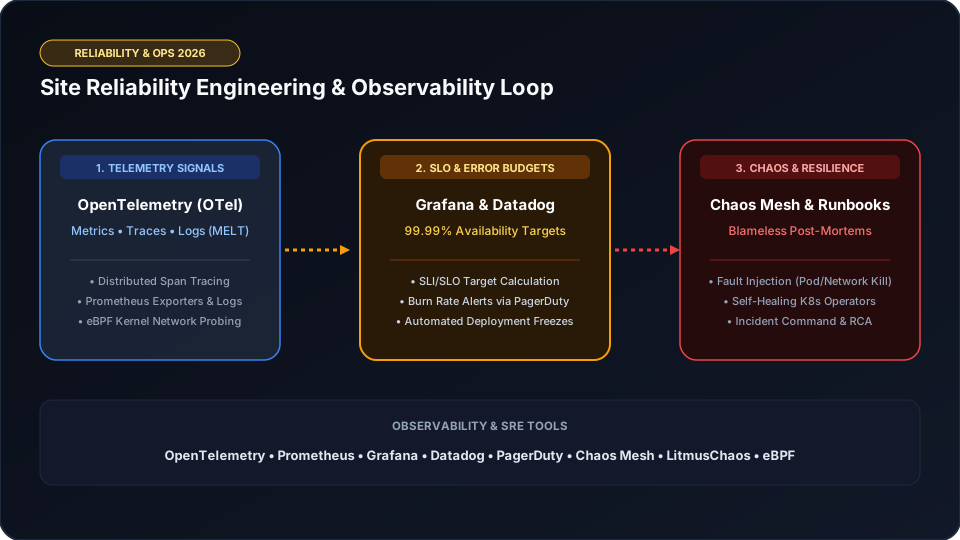
SRE Observability & Automated Resilience Loop
Distributed systems telemetry pipeline showing OpenTelemetry MELT signals, SLO burn rate alerting, Chaos Mesh fault injection, and auto-healing runbooks.
OpenTelemetry (OTel) Signals
Unified collection of Metrics, Events, Logs, and Distributed Traces (MELT) across microservices and eBPF kernel probes.
SLO & Error Budget Gatekeeping
Quantifying reliability targets (e.g. 99.99% availability) to mathematically balance feature release velocity against stability.
Chaos Engineering & Fault Testing
Injecting controlled latency, network partition, and pod termination using Chaos Mesh to discover failure modes proactively.
Automated Incident Remediation
Automated PagerDuty escalation policies, blameless post-mortem templates, and auto-rollback canary deployments.
Structured Week-by-Week Learning Syllabus
Focus on build-by-doing milestones rather than passive video lectures.
Phase 1: OpenTelemetry (OTel) Instrumentation & Distributed Tracing
- The 4 Golden Signals: Latency, Traffic, Errors, and Saturation
- Instrumenting distributed microservices with OpenTelemetry SDKs and Collectors
- Correlating distributed trace spans with application logs and Prometheus metrics
Phase 2: SLOs, SLIs, Error Budgets & Intelligent Alerting
- Calculating practical SLIs, defining realistic SLOs, and tracking Error Budget burn rates
- Designing multi-window multi-burn-rate alert rules in Prometheus and Datadog
- Eliminating alert fatigue and establishing high-fidelity on-call rotation schedules
Phase 3: Chaos Engineering, Capacity Planning & Incident Management
- Executing controlled chaos experiments (Pod kill, CPU stress, Network delay) with Chaos Mesh
- Canary deployments with automated progressive rollouts and instant rollback (Argo Rollouts)
- Facilitating blameless post-mortems and developing self-healing runbook automations
Top Interview Questions & Answers
Q1: What is an Error Budget and how does an SRE use it to balance velocity and reliability?
An Error Budget is the allowable room for failure calculated from an SLO (e.g., a 99.9% SLO allows a 0.1% error budget). If the error budget is healthy, developers can ship features aggressively. If an incident or regressions burn through the error budget, feature releases are temporarily halted, and engineering capacity shifts exclusively to reliability and technical debt reduction.
Q2: Explain the 4 Golden Signals of monitoring defined by Google SRE.
1. Latency: Time taken to service a request (differentiating success vs error latency). 2. Traffic: Demand on system (requests/sec or network IO). 3. Errors: Rate of failed requests (HTTP 500s or protocol exceptions). 4. Saturation: How full the service is (CPU, memory, database connection pool limits).
Frequently Asked Questions
Do SREs write application code?
Yes. SREs spend at least 50% of their time writing software (automation scripts, operators, observability exporters, chaos tests) to eliminate toil and make systems self-healing.
What certifications are valued for SRE roles?
CKA (Certified Kubernetes Administrator), AWS Certified DevOps Engineer Professional, and Google Professional Cloud DevOps Engineer.
Target Job Roles
Site Reliability Engineer (SRE)
Demand: Very HighStaff SRE / Reliability Architect
Demand: HighObservability & Monitoring Engineer
Demand: HighRelated Career Tracks
Not sure if Site Reliability Engineering (SRE) & Observability is right for you?
Take our 30-second career quiz to find your highest-ROI match.
Start Free Quiz